Financial Reporting with Power BI
In today’s fast-paced business world, Power BI has revolutionized the way organizations handle financial reporting. With its interactive dashboards, real-time insights, and dynamic visuals, Power BI enables finance professionals to transform raw data into meaningful reports that drive informed decisions. It seamlessly integrates with Excel, ERP systems, and cloud databases, ensuring accuracy and automation in every report. From cash flow and P&L statements to balance sheets and variance analysis, Power BI empowers users to monitor performance at a glance. Mastering Financial Reporting with Power BI means gaining the ability to visualize data that tells a clear financial story.
Outline
Module 1: Introduction to Financial Reporting in Power BI
• What is Financial Reporting & its importance.
• Types of Financial Reports (P&L, Balance Sheet, Cash Flow, KPI Dashboards).
• Overview of Power BI interface & key components (Power Query, Data Model, DAX, Visualization).
• Importing financial data from Excel.
• Understanding structured vs unstructured data.
Module 2: Data Preparation using Power Query
• Common issues in financial datasets (unpivoting, date errors, inconsistent headers).
• Cleaning and transforming data:
o Split columns, merge, fill down, replace values.
o Correcting data types & date formats.
o Creating conditional columns
o Merging multiple sheets/tables
• Creating a Calendar table in Power Query.
• Appending data for multiple years.
• Power Query best practices for finance data.
Module 3: Data Modeling & Relationships
• Understanding fact & dimension tables.
• Designing data models for financial statements.
• Creating relationships between tables
• Understanding “one-to-many” vs “many-to-one” relationships.
• Creating a measure table for DAX.
Module 4: Financial Metrics & DAX Measures
• Review of common financial metrics:
o Gross Profit, Operating Income, Net Profit.
o Expense Ratios, Margin %, Growth %, etc.
• Essential DAX functions:
o CALCULATE, FILTER, DIVIDE, ALL, REMOVEFILTERS
o Time Intelligence: DATESINPERIOD, DATEADD, SAMEPERIODLASTYEAR etc
o SWITCH, TOPn , RANKx etc
• Creating KPIs and trend measures.
• Year-over-Year (YoY) and Month-over-Month (MoM) analysis.
• Creating dynamic financial ratios dashboard.
Module 5: Designing Financial Dashboards
• Visualizing Income Statement, Balance Sheet & Cash Flow.
• Choosing right visuals for finance data (Matrix, Waterfall, Cards, KPIs).
• Conditional formatting and custom tooltips.
• Adding slicers, buttons, and navigation between reports.
• Using Bookmarks for dynamic views (e.g., Actual vs Forecast).
• Creating dynamic titles and measure-driven visuals.
Module 6: Power BI Service
• Publishing Report into Power BI Service
• Setting up data refresh automation and scheduled updates in Power BI Service.
• Managing workspaces, roles, and access controls for secure report sharing
Course Fee
● Online
Rs. 5,000/- Total
- Once paid, the fee is non-refundable and non-transferable
Account Details
Bank: Habib Bank Limited
Account Title: AIN GenX
Account No: 5910-70000512-03
IBAN No: PK08 HABB 0059 1070 0005 1203
Facilitators

Irfan Bakaly
Data Analyst
25+ years of experience in Data Analysis

Noor Surani
Tech Entrepreneur
25+ years of experience in Data Analysis
Who this course is for:
Data Analysts, Business Intelligence (BI) Professionals, Excel Power Users Transitioning to Power BI, Data Engineers / ETL Developers, IT and Reporting Managers
Duration
● 5 Weeks (15 Hours)
Classes
● Online via Zoom
Schedule
- Day: Sunday's Only
- Timing: 02:30 - 05:00 pm (PST)
Starting From
● Sunday, 11 January, 2026
Participants from Top Organizations


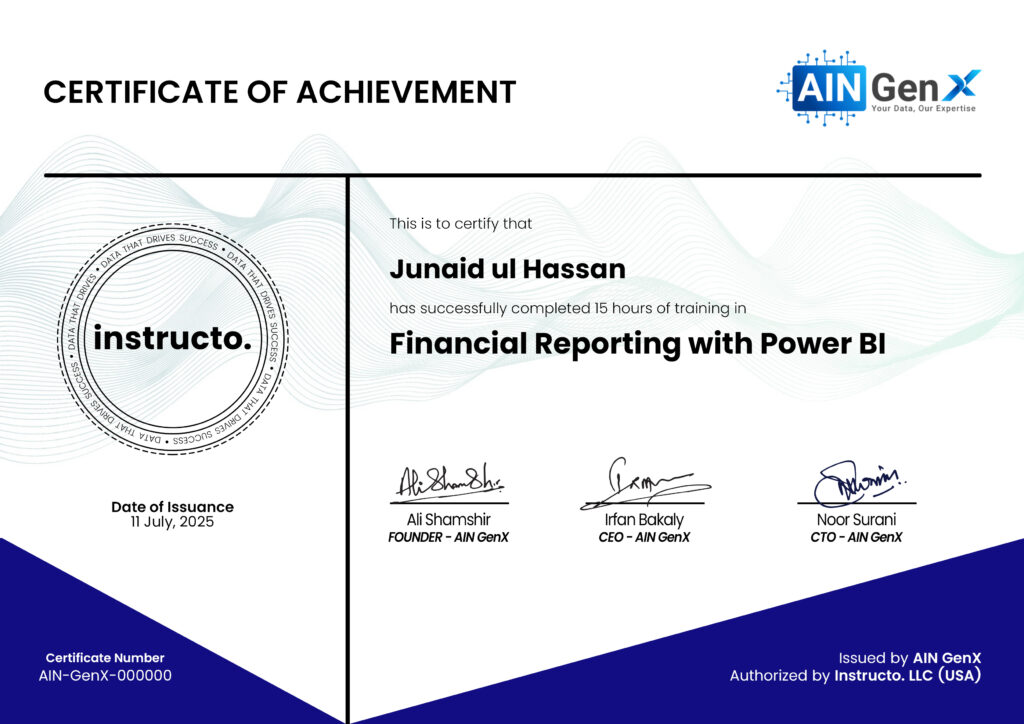
Certificates

