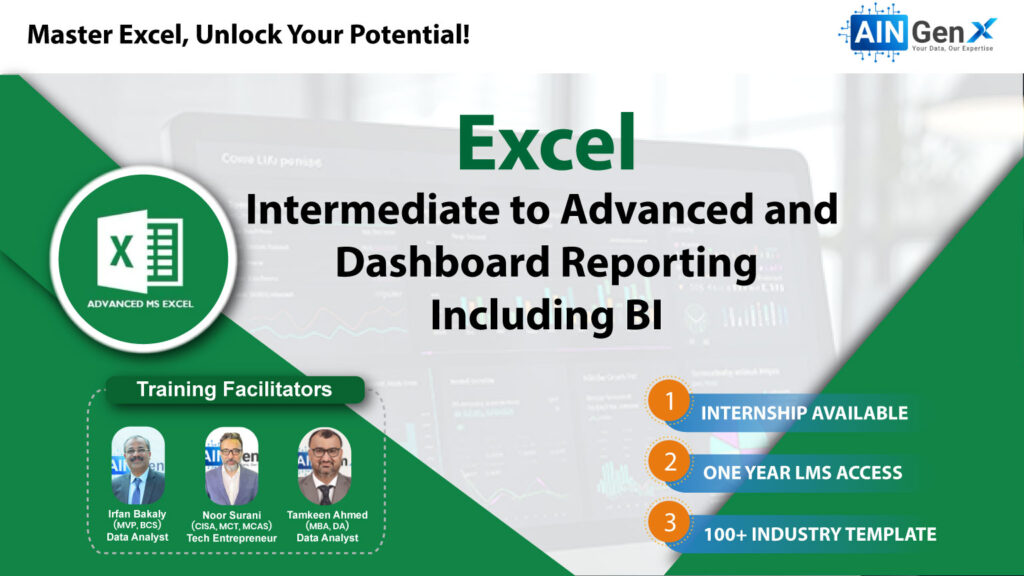
Excel Intermediate to Advanced & Dashboard with BI
Take Your Data Analysis to the Next Level

Excel Intermediate to Advanced & Dashboard with BI
Unlocking the full potential of Excel requires moving beyond basic functions and embracing its advanced features. Transitioning from intermediate to advanced proficiency opens doors to powerful capabilities, particularly in creating dynamic dashboards with Business Intelligence (BI) integration. In this journey, users delve into complex functions, pivot tables, data visualization techniques, and advanced formulas. Mastering Excel empowers professionals to transform raw data into actionable insights. Integrating BI tools like Power BI elevates dashboard creation, offering interactive visualizations and real-time data analysis. Embrace the evolution from Excel novice to proficient user, unlocking new realms of data-driven decision-making.
Module 1: Excel for Data Analysis
• Excel shortcuts make life easy
• Data Validation
• Data Analysis techniques
• Filter, Multi Filter, Sort, Multi Sort and Custom Sort
• Conditional Formatting
• Working with Basic Charts
• Working with Multiple Worksheets and workbooks (Links)
• Applying Security to Files, Workbooks & Worksheets
Module 2: Essential Formulas for Data Analysis
• SUM, AVERAGE, COUNT, MIN, MAX for basic calculations
• AVERAGEIFS, COUNTIFS, SUMIFS for multi-condition analysis
• SUBTOTAL for filter data analysis
Module 3: Logical and Lookup Functions
• Logical Functions (IF, AND, OR)
• VLOOKUP, HLOOKUP, and XLOOKUP for searching data
• INDEX and MATCH for advanced lookup scenarios
Module 4: Advanced Data Analysis Techniques
• Consolidating Techniques
• Working with the Name Manager
• Advanced Charting and Graphs
• Data Analysis with What-If Analysis Tools
Module 5: Data Analysis with Pivot Tables
• Creating Pivot Tables from raw data
• Summarizing data using Pivot Tables
• Grouping data by categories, dates, and values
• Calculated fields and items for custom analysis
• Using slicers to filter data interactively
• Creating dynamic Pivot Charts from Pivot Table data
• Formatting and customizing charts for presentation
Module 6: Visualizing Data with Charts
• Bar, line, pie, and column charts for visualizing trends
• Adding and formatting data labels, axes, and legends
• Combination charts (e.g., bar and line charts)
• Sparklines for in-cell mini charts
Module 7: Dashboards and Reporting in Excel
• Designing a dashboard layout for clear data representation
• Using Pivot Tables, Pivot Charts, slicers, and form controls for interactive dashboards
• Design Principles for Effective Dashboards
• Ensuring consistency, clarity, and readability
• Optimizing dashboards for sharing and collaboration
• Exporting dashboards and reports as PDFs or Excel workbooks
• Protecting data and restricting access to sensitive information
• Conditional Formatting for Data Highlighting
Module 8: Data Analysis with Power Query
• Importing data from multiple sources
• Cleaning and transforming data using Power Query
• Combining data from multiple tables and sources
• Creating automated data transformations
○ Expert Instruction: Our training is led by experienced instructors who are experts in Excel, Business Intelligence, and data visualization. Benefit from their in-depth knowledge, practical insights, and personalized guidance throughout the course.
○ Comprehensive Curriculum: Our curriculum covers a wide range of topics, from intermediate to advanced Excel functions to creating dynamic dashboards with BI tools. Gain a comprehensive understanding of Excel and BI techniques that are essential for data analysis professionals.
○ Hands-On Learning: We believe in learning by doing. Our training emphasizes hands-on exercises, real-world case studies, and practical projects to reinforce learning and ensure that you can apply your skills confidently in a professional setting.
○ Customized Learning Experience: Whether you're a beginner looking to build a solid foundation in Excel or an experienced user seeking to enhance your skills, our training is tailored to meet your specific needs and learning goals. We offer flexible learning options and personalized support to accommodate diverse learning styles and preferences.
○ Career Advancement Opportunities: Mastering Excel Intermediate to Advanced & Dashboard with BI skills opens doors to exciting career opportunities in data analysis, business intelligence, finance, and more. Our training equips you with the skills and knowledge needed to advance your career and stay ahead in today's competitive job market.
○ Networking and Collaboration: Joining our training program gives you access to a vibrant community of fellow learners, industry professionals, and experts in the field. Connect with like-minded individuals, share insights, and collaborate on projects to expand your professional network and enhance your learning experience.
○ Continuous Support and Resources: Learning doesn't end when the training concludes. We provide ongoing support, resources, and access to updated materials to help you stay updated with the latest trends, tools, and techniques in Excel and Business Intelligence.
○ Proven Track Record: Our training program has a proven track record of success, with many satisfied participants who have successfully applied their skills to excel in their careers. Join the ranks of our successful alumni and take your Excel and BI skills to the next level with us.
- Basic Excel Proficiency: While prior experience with Excel is not mandatory, candidates should have a basic understanding of Excel fundamentals, including navigating the interface, entering data, creating formulas, and formatting worksheets.
- Computer Skills: Candidates should possess basic computer skills and be comfortable using software applications. Proficiency in Microsoft Office Suite, including Excel, is preferred but not mandatory.
- Enhanced Data Analysis Skills: By mastering intermediate to advanced Excel functions and techniques, you'll gain the ability to analyze complex datasets more efficiently and derive deeper insights from your data.
- Better Decision-Making: With advanced Excel skills, you'll be able to create dynamic dashboards and reports that provide actionable insights at a glance. This empowers decision-makers to make informed decisions quickly and effectively.
- Professional Development: Excel is a fundamental tool used in many industries, including finance, marketing, consulting, and healthcare. By mastering advanced Excel skills, you'll enhance your professional profile and increase your value to employers.
The scope of learning Excel Intermediate to Advanced & Dashboard with BI Training is broad and encompasses various opportunities for professional growth and career advancement. Here are some key aspects of the scope:
- Advanced Data Analysis: With intermediate to advanced Excel skills, you'll be equipped to perform complex data analysis tasks efficiently. From manipulating large datasets to conducting advanced calculations and generating insightful reports, you'll have the expertise to tackle diverse analytical challenges.
- Dynamic Dashboard Creation: Mastery of Excel's advanced features allows you to design dynamic and visually appealing dashboards. By showcasing key performance indicators, trends, and insights in an interactive format, you can facilitate informed decision-making and drive organizational success.
- Business Intelligence Integration: Integrating Excel with Business Intelligence (BI) tools such as Power BI and Tableau expands the scope of your data analysis capabilities. You'll learn how to leverage these tools to create interactive dashboards, perform advanced data visualization, and gain deeper insights into your data.
- Career Opportunities: Proficiency in Excel Intermediate to Advanced & Dashboard with BI Training opens doors to a wide range of career opportunities across industries. Roles such as data analyst, business intelligence analyst, financial analyst, and management consultant often require advanced Excel skills and dashboard creation expertise.
- Continuous Learning and Advancement: The field of data analysis and business intelligence is dynamic and constantly evolving. By staying updated with the latest trends, tools, and techniques, you can continue to advance your skills and stay competitive in the job market.
Who is this training course suitable for?
This training course is suitable for anyone who wants to enhance their Excel skills from an intermediate to advanced level and learn how to create dynamic dashboards using Business Intelligence (BI) tools. It's ideal for business analysts, data analysts, financial professionals, and anyone else who works with data regularly.
What are the prerequisites for this course?
Participants should have a basic understanding of Excel fundamentals, including functions, formulas, and basic data manipulation. Familiarity with PivotTables is recommended but not required. No prior experience with BI tools is necessary.
What topics are covered in the Excel Intermediate to Advanced portion of the course?
The Excel Intermediate to Advanced portion covers a range of topics, including advanced functions (such as VLOOKUP, INDEX-MATCH, and SUMIFS), PivotTables and PivotCharts, data validation, conditional formatting, advanced data analysis techniques, and more.
What topics are covered in the Dashboard with BI portion of the course?
The Dashboard with BI portion covers the creation of dynamic dashboards using popular BI tools such as Power BI and Tableau. Topics include data visualization best practices, dashboard design principles, connecting Excel data to BI tools, creating interactive visualizations, and sharing insights with stakeholders.
What is the duration of the course?
The duration and format of the training is 6 weeks.
Do I need to have prior experience with BI tools to take this course?
No, prior experience with BI tools is not required. The course will cover the basics of using BI tools such as Power BI and Tableau, allowing participants to learn how to create dynamic dashboards from scratch.
Is certification available upon completion of the training?
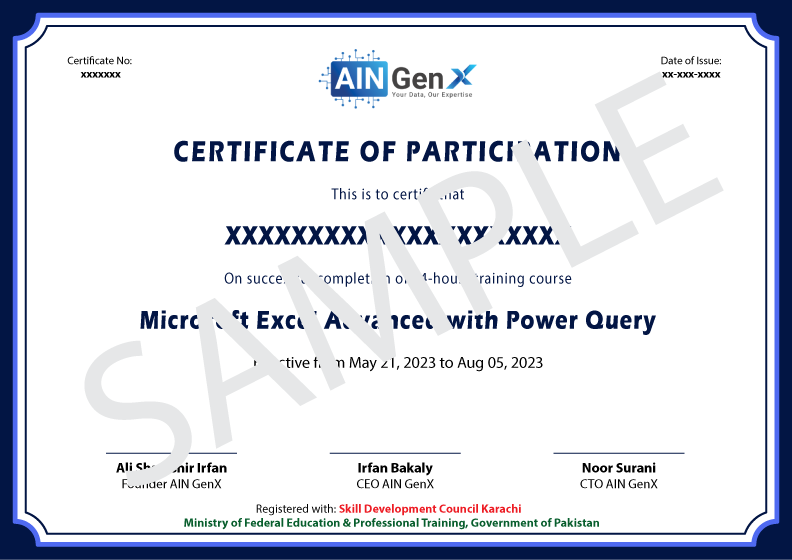
Successful participants will get the AIN GenX and Skill Development Council Karachi certificates.
What software/tools do I need to participate in the course?
Participants will need access to Microsoft Excel (preferably the latest version) and either Power BI Desktop or Tableau Public (both of which are free to download). Instructions for downloading and installing these tools will be provided at the beginning of the course.
Instructor

Irfan Bakaly
Data Analyst
24+ years of experience in Data Analysis

Noor Surani
Tech Entrepreneur
25+ years of experience in Data Analysis

Tamkeen Ahmed
Supply Chain Profession
5+ years of Teaching Experience
Who this course is for:
Excel Users Seeking Advanced Skills
Duration
● 6 Weeks (18 Hours)
Classes
● Online via Zoom
Schedule
- Day: Sunday's only
- Timing: 11:00 am to 02:00 pm
Starting From
● Sunday, Jan 19, 2025
Course Fee
● Online Fee: Rs. 7,000/- (One Time Payment)
Excluding the SDC Certificate Fee
Account Details
Bank: Bank: Habib Bank Limited
Account Title: AIN GenX
Account No: 5910-70000512-03
IBAN No: PK08 HABB 0059 1070 0005 1203


