Advanced Data Analytics & AI
Excel Intermediate - Advanced, Power Query, Power BI (DAX & M), Tableau, Microsoft Fabric (Data Automation), SQL, Python for Data Analysis, Machine Learning & AI, Prompts-to-Production with Copilot, Gemini, ChatGPT, DeepSeek, Grok & Claude
Advanced Data Analytics & AI turns scattered data into confident decisions. In this program, you’ll master Excel (Intermediate–Advanced) with Power Query and Power Pivot, then model and visualize in Power BI using DAX and M. You’ll explore Tableau for rapid insights and Microsoft Fabric for streamlined data automation. Build rock-solid foundations with SQL. Move into Python for Data Analysis, and apply Machine Learning and AI to real business problems. Finally, go prompts-to-production using Copilot, Gemini, ChatGPT, DeepSeek, Grok, and Claude —shipping reliable, cost-aware AI workflows end to end today.
Outline
Module 1: Excel for Data Analysis
Excel for Data Analysis
• Excel shortcuts make life easy
• Data Validation
• Data Analysis techniques
• Filter, Multi Filter, Sort, Multi Sort and Custom Sort
• Conditional Formatting
• Working with Basic Charts
• Working with Multiple Worksheets and workbooks (Links)
• Applying Security to Files, Workbooks & Worksheets
Essential Formulas for Data Analysis
• SUM, AVERAGE, COUNT, MIN, MAX for basic calculations
• AVERAGEIFS, COUNTIFS, SUMIFS for multi-condition analysis
• SUBTOTAL for filter data analysis
Logical and Lookup Functions
• Logical Functions (IF, AND, OR)
• VLOOKUP, HLOOKUP, and XLOOKUP for searching data
• INDEX and MATCH for advanced lookup scenarios
Advanced Data Analysis Techniques
• Consolidating Techniques
• Working with the Name Manager
• Advanced Charting and Graphs
• Data Analysis with What-If Analysis Tools
Data Analysis with Pivot Tables
• Creating Pivot Tables from raw data
• Summarizing data using Pivot Tables
• Grouping data by categories, dates, and values
• Using slicers to filter data interactively
• Creating dynamic Pivot Charts from Pivot Table data
• Formatting and customizing charts for presentation
Visualizing Data with Charts
• Bar, line, pie, and column charts for visualizing trends
• Adding and formatting data labels, axes, and legends
• Combination charts (e.g., bar and line charts)
Dashboards and Reporting in Excel
• Designing a dashboard layout for clear data representation
• Design Principles for Effective Dashboards
• Optimizing dashboards for sharing and collaboration
• Exporting dashboards and reports as PDFs or Excel workbooks
• Protecting data and restricting access to sensitive information
• Conditional Formatting for Data Highlighting
• Creating Sparklines for In-Line Data Trends
Data Analysis with Power Query
• Importing data from multiple sources
• Cleaning and transforming data using Power Query
• Combining data from multiple tables and sources
• Creating automated data transformations
Module 2: Power BI for Data Analysis
Introduction to Power BI Desktop
• Overview of Power BI components: Desktop, Service, and Mobile
• Key features and benefits of Power BI Desktop
• Understanding the Power BI interface and workflow
Data Transformation with Power Query
• Importing data from Excel, databases, CSV files, and cloud services
• Handling multiple data sources
• Removing duplicates and filtering data
• Pivoting and unpivoting data
• Splitting and merging columns
• Conditional columns
• Replacing and transforming values
• Grouping and aggregating data
• Merging and appending queries
Data Modeling in Power BI
• Creating a Data Model
• Defining relationships between tables
• Star schema and snowflake schema in Power BI
• Difference between calculated columns and measures
• Creating calculated columns for custom data
• Hiding and sorting columns
• Managing relationships and model performance
DAX (Data Analysis Expressions) Functions
• Introduction to DAX
• Syntax and structure of DAX
• Understanding row context and filter context
• Aggregation functions: SUM, MIN, MAX, COUNT, AVERAGE
• Logical functions: IF, SWITCH
• Text functions: CONCATENATE, LEFT, RIGHT
• Time intelligence functions: DATEADD, SAMEPERIODLASTYEAR, YTD, QTD, MTD
• Advanced measures for financial analysis (e.g., YTD growth, % changes)
• Handling complex scenarios with CALCULATE and FILTER
Data Visualization and Reporting
• Best Practices in Data Visualization
• Choosing the right visual for your data
• Overview of visualization types: bar charts, line charts, pie charts, maps, etc.
• Building dynamic and interactive visuals
• Customizing Visuals
• Formatting and styling visuals for clarity and impact
• Conditional formatting for highlighting key insights
• Using slicers and filters to add interactivity
• Creating drill-through and drill-down capabilities for deeper analysis
• Adding tooltips and custom visuals for enhanced reporting
• Simplifying and decluttering reports for better readability
Report Sharing and Collaboration
• Publishing reports to the cloud (Power BI Service)
• Sharing reports via email, Teams, and embedding in websites
• Setting up automatic data refreshes
• Scheduling reports and dashboards to update regularly
Module 3: SQL for Data Analysis
Introduction to SQL Server
• Overview of SQL Server
• What is SQL Server?
• Installation and Setup
• SQL Server Management Studio (SSMS) Interface
Basics of SQL
• Introduction to SQL
• SQL Syntax and Structure
• Data Types
• Basic SQL Commands
• SELECT, FROM, WHERE
• INSERT, UPDATE, DELETE
• Filtering and Sorting Data
• WHERE Clause
• ORDER BY Clause
Advanced SQL Queries
• Aggregate Functions
• COUNT, SUM, AVG, MIN, MAX
• Grouping Data
• GROUP BY Clause
• HAVING Clause
• Joining Tables
• INNER JOIN, LEFT JOIN, RIGHT JOIN, FULL JOIN
Data Manipulation and Transformation
• Subqueries and Nested Queries
• Common Table Expressions (CTEs)
• Window Functions
• ROW_NUMBER(), RANK(), DENSE_RANK(), NTILE()
• Data Transformation Techniques
Working with Complex Data Types
• Working with Dates and Times
• Date Functions
• String Functions
• CONCAT, SUBSTRING, CHARINDEX, REPLACE
SQL Server Advanced Topics
• Indexing and Performance Tuning
• Creating and Managing Indexes
• Query Optimization
• Stored Procedures and Functions
• Creating and Executing Stored Procedures
• User-Defined Functions
Data Analysis and Reporting
• Basic Data Analysis Techniques
• Descriptive Statistics
• Using SQL for Data Analysis
• Exploratory Data Analysis (EDA)
• Generating Reports
• Creating Simple Reports in SSMS
• Exporting Data to Excel
Module 4: Python for Data Analysis
Module 4: Python for Data Analysis • Introduction to Python and its role in data analysis • Understanding Python syntax and basic language structure • Working with simple Python statements and expressions • Overview of commonly used Python environments Python Fundamentals and Core Concepts • Rules, syntax, indentation, and naming conventions • Understanding objects and variables in Python • Common data types and basic type conversion • Identifying common errors and basic debugging approaches Operators, Functions, and Program Logic • Using arithmetic, comparison, and logical operators • Working with built-in Python functions • Creating and using basic user-defined functions • Applying conditional statements for decision-making Loops and Repetitive Operations • Understanding iteration and repetitive tasks • Working with for loops and while loops • Applying basic loop controls • Combining conditions and loops for simple workflows Libraries and Packages for Data Analysis • Understanding libraries, packages, and modules • Importing and using commonly used Python libraries • Working with structured data using Python • Performing basic data exploration and manipulation Applied Data Analysis Practice • Working with sample and industry-style data files • Preparing and reviewing data for analysis • Applying Python concepts to practical analytical tasks • Developing simple end-to-end analysis workflows Capstone Projects • Understanding a practical data analysis scenario • Importing, reviewing, and preparing provided datasets • Applying relevant Python techniques to analyze data • Summarizing observations and presenting analytical outputs
Module 5: Tableau for Data Analysis (Recorded videos)
Introduction to Tableau
• Overview of Tableau and its uses in data analysis.
• Understanding the Tableau interface.
• Connecting to data sources.
Data Preparation
• Data sourcing and importing.
Visualization Basics
• Creating basic visualizations (bar charts, line charts, pie charts, etc.).
• Applying filters and sorting data.
• Formatting visualizations for clarity.
Advanced Visualization Techniques
• Creating interactive dashboards.
• Using parameters and calculated fields.
• Implementing advanced chart types (treemaps, heatmaps, etc.).
Data Analysis
• Exploring trends and patterns in data.
• Conducting ad-hoc analysis with Tableau.
• Utilizing forecasting and trend analysis tools.
Mapping Data
• Geospatial analysis with maps.
.
• Analyzing location-based data.
Sharing and Collaboration
• Publishing workbooks to Tableau Public.
• Sharing insights and visualizations with stakeholders.
• Collaborating on projects within Tableau.
Module 6: Microsoft Fabric
1. Introduction to Microsoft Fabric
• What is Microsoft Fabric
• How it connects with Power BI
2. Getting Started with Power BI in Fabric
• Navigating the interface
• Creating a workspace
• Uploading and managing data
3. Data Preparation (Simple Level)
• Importing Excel and basic data sources
• Cleaning data using simple steps
• Saving and organizing datasets
4. Building Reports & Dashboards
• Creating basic visuals (charts, tables, KPIs)
• Using filters and slicers
• Designing simple dashboards
5. Sharing & Collaboration
• Publishing reports
• Sharing dashboards with team
• Managing access and permissions
6. Using Fabric for Daily Work
• Centralized data access
• Reusing reports
• Improving reporting efficiency
Module 7: AI tools: Gemini, ChatGPT, DeepSeek, Grok, Claude & Copilot
What is an AI assistant?
Learn the difference between a search engine and an AI — and why that matters for your work.
1. AI vs Google Search — what's different
2. How AI reads your instructions (prompts)
3. What AI can and cannot do reliably
Choosing the right tool
Each AI has strengths. Learn which tool fits which task before you start.
1. Copilot
2. Gemini
3. ChatGPT, DeepSeek, Grok — web-based general use
4. Claude with MCP
Writing emails
Draft, reply, and rewrite emails in seconds.
1. Write a meeting request email
2. Reply professionally to a complaint
3. Summarise a long email thread
Summarising documents
Turn long reports and PDFs into short, clear summaries.
1. Paste text and ask for a summary
2. Extract key decisions from meeting notes
3. Create bullet-point action items
The 4-part prompt formula
A clear prompt gets a useful result. Learn the formula every beginner needs.
1. Role — "You are a professional writer..."
2. Task — "Write a summary of..."
3. Context — "The audience is my manager..."
4. Format — "Reply in 3 bullet points"
Common beginner mistakes
Avoid these pitfalls that waste time and produce bad results.
1. Being too vague ("write something about sales")
2. Trusting AI without fact-checking
3. Sharing confidential data in public AI tools
AI for Industry-Specific Use Cases
Apply AI in real corporate scenarios
Module 8: Start Freelancing on Upwork
Introduction to Upwork
• What is Upwork?
• Benefits of being an Upwork freelancer
• Overview of the Upwork platform
Setting Up Your Upwork Profile
• Creating an effective profile
• Crafting a compelling title and overview
• Highlighting your skills and expertise
• Building a portfolio and showcasing your work
Finding and Applying for Jobs
• Search strategies and filters
• Understanding job descriptions and requirements
• Crafting winning proposals
• Following up on proposals and interviews
Upwork Fees and Billing
• Understanding Upwork's fee structure
• Setting your rates and pricing strategies
• Invoicing and getting paid
Communication and Client Management
• Effective communication with clients
• Setting expectations and deliverables
• Managing revisions and feedback
• Building long-term client relationships
Upwork's Policies and Guidelines
• Upwork's terms of service
• Maintaining a good job success score
• Handling disputes and resolving issues
Growing Your Upwork Business
• Building a strong reputation and profile
• Earning and maintaining high ratings
• Leveraging Upwork's features and tools
• Expanding your service offerings
Bonus Tips and Best Practices
• Time management and productivity tips
• Networking and collaboration opportunities
• Continuing education and skill development
• Q&A and open discussion
Course Fee
● Online
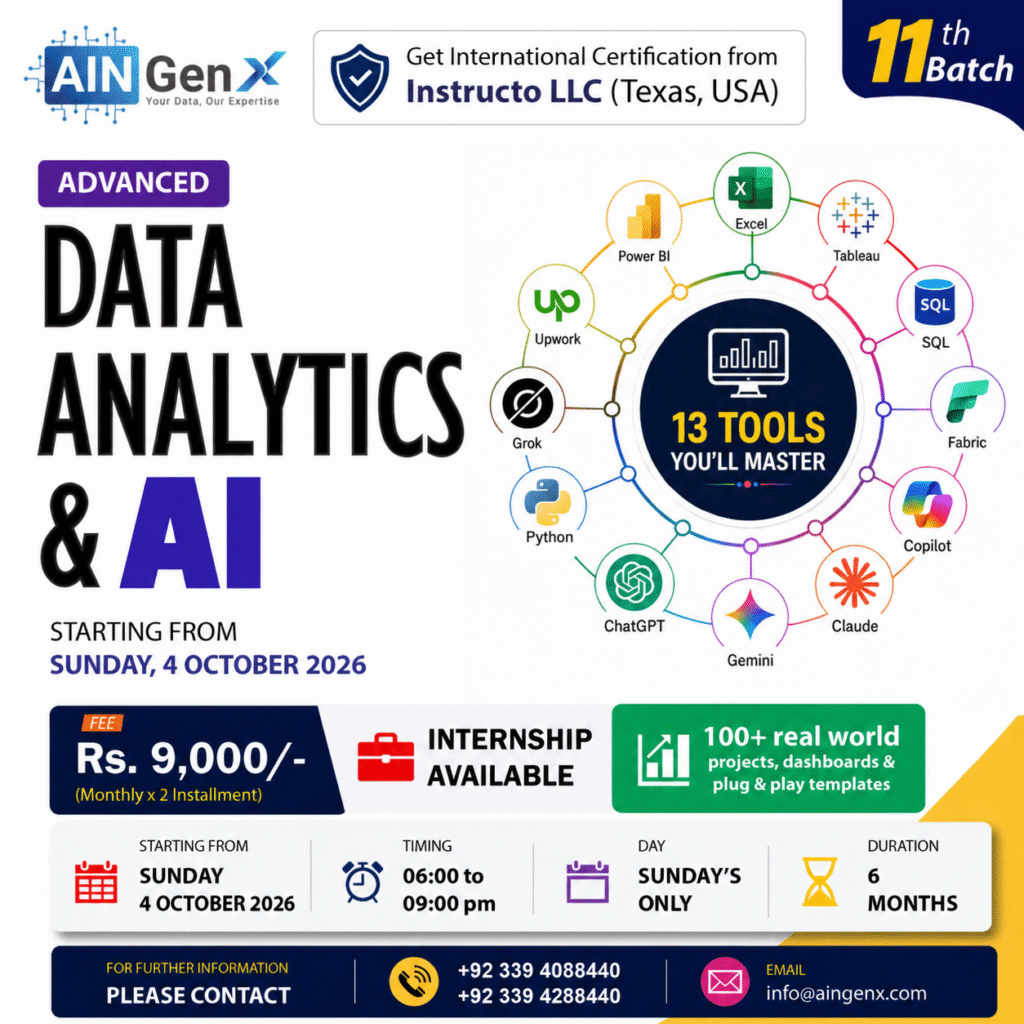
Rs. 9,000/- x 2 Installment
Fee once paid is not refundable and not transferable.
Account Details
Bank: Habib Bank Limited
Account Title: AIN GenX
Account No: 5910-70000512-03
IBAN No: PK08 HABB 0059 1070 0005 1203
Facilitators

Irfan Bakaly
Data Analyst
26+ years of experience in Data Analysis

Noor Surani
Tech Entrepreneur
26+ years of experience in Data Analysis
Who this course is for:
Working Professionals, Entrepreneurs & Business Owners, Beginners & Students, Anyone Interested in Data
Duration
● 6 Months (72 Hours)
Classes
● Online via Zoom
Schedule
- Day: Sunday's Only
- Timing: 06:00 - 09:00 pm (PST)
Starting From
● Sunday, 4 October, 2026
Participants from Top Organizations












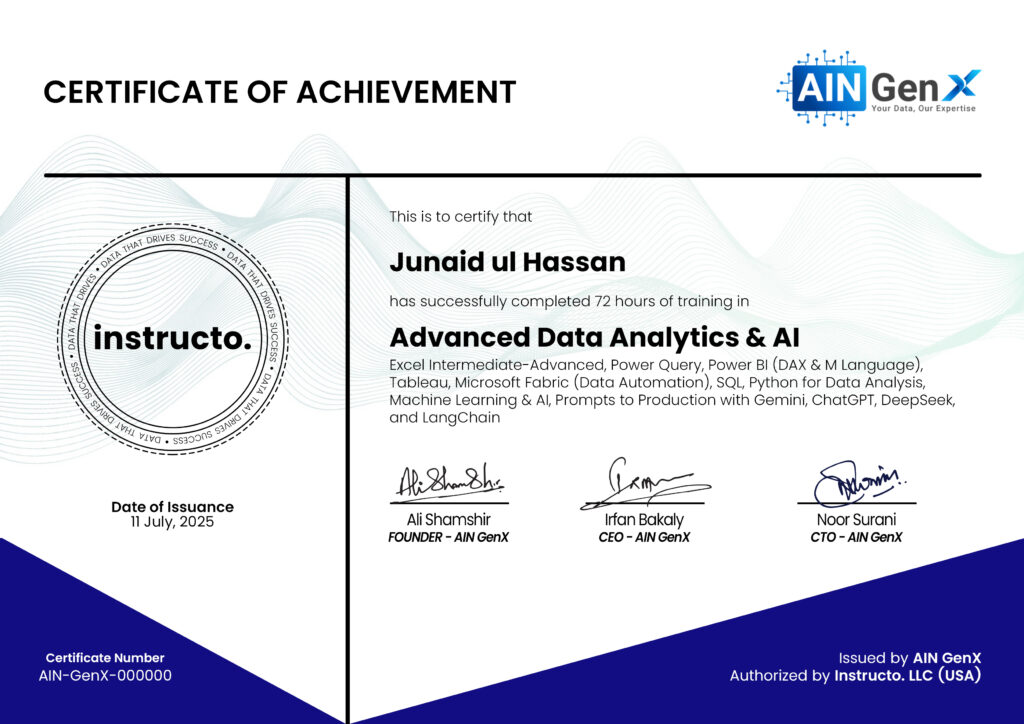
Certificates