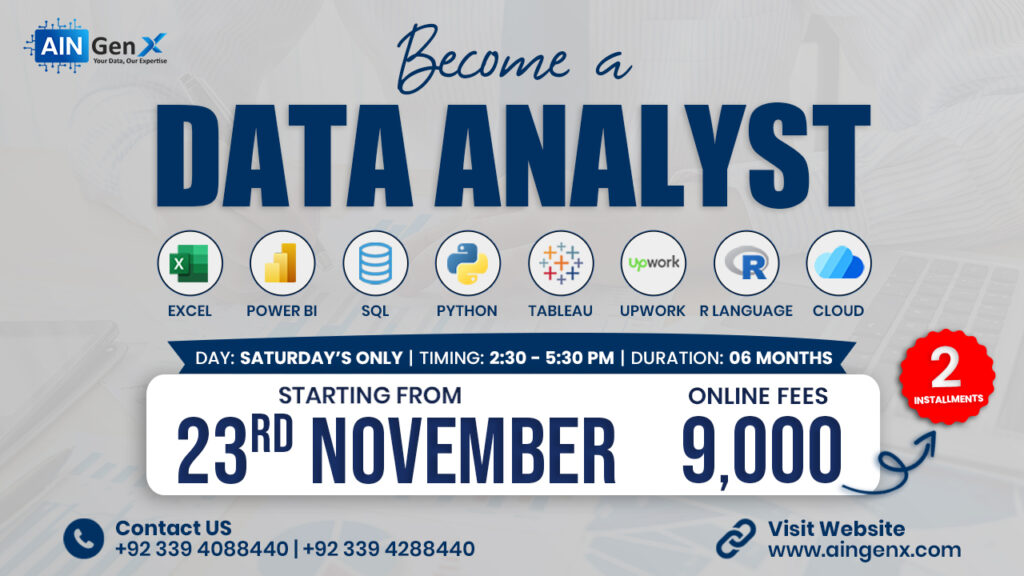
Become a Data Analyst
MS Excel | Power BI | SQL | Python
Add-Ons: Tableau | R | Cloud Computing | Upwork
Become a Data Analyst
MS Excel | Power BI | SQL | Python
Join our "Become a Data Analyst" course and master MS Excel, Power BI, SQL, and Python.
Through these 72 hours of classes, you'll gain the skills necessary to thrive in the competitive job market or launch a successful freelance career. Unleash your potential as a data analyst!
Module 1: Excel for Data Analysis
Excel for Data Analysis
• Excel shortcuts make life easy
• Data Validation
• Data Analysis techniques
• Filter, Multi Filter, Sort, Multi Sort and Custom Sort
• Conditional Formatting
• Working with Basic Charts
• Working with Multiple Worksheets and workbooks (Links)
• Applying Security to Files, Workbooks & Worksheets
Essential Formulas for Data Analysis
• SUM, AVERAGE, COUNT, MIN, MAX for basic calculations
• AVERAGEIFS, COUNTIFS, SUMIFS for multi-condition analysis
• SUBTOTAL for filter data analysis
Logical and Lookup Functions
• Logical Functions (IF, AND, OR)
• VLOOKUP, HLOOKUP, and XLOOKUP for searching data
• INDEX and MATCH for advanced lookup scenarios
Advanced Data Analysis Techniques
• Consolidating Techniques
• Working with the Name Manager
• Advanced Charting and Graphs
• Data Analysis with What-If Analysis Tools
Data Analysis with Pivot Tables
• Creating Pivot Tables from raw data
• Summarizing data using Pivot Tables
• Grouping data by categories, dates, and values
• Calculated fields and items for custom analysis
• Using slicers to filter data interactively
• Creating dynamic Pivot Charts from Pivot Table data
• Formatting and customizing charts for presentation
Visualizing Data with Charts
• Bar, line, pie, and column charts for visualizing trends
• Adding and formatting data labels, axes, and legends
• Combination charts (e.g., bar and line charts)
• Sparklines for in-cell mini charts
Dashboards and Reporting in Excel
• Designing a dashboard layout for clear data representation
• Using Pivot Tables, Pivot Charts, slicers, and form controls for interactive dashboards
• Design Principles for Effective Dashboards
• Ensuring consistency, clarity, and readability
• Optimizing dashboards for sharing and collaboration
• Exporting dashboards and reports as PDFs or Excel workbooks
• Protecting data and restricting access to sensitive information
• Conditional Formatting for Data Highlighting
• Creating Sparklines for In-Line Data Trends
Data Analysis with Power Query
• Importing data from multiple sources
• Cleaning and transforming data using Power Query
• Combining data from multiple tables and sources
• Creating automated data transformations
Module 2: Power BI for Data Analysis
Introduction to Power BI Desktop
• Overview of Power BI components: Desktop, Service, and Mobile
• Key features and benefits of Power BI Desktop
• Understanding the Power BI interface and workflow
Data Transformation with Power Query
• Importing data from Excel, databases, CSV files, and cloud services
• Handling multiple data sources
• Removing duplicates and filtering data
• Pivoting and unpivoting data
• Splitting and merging columns
• Conditional columns
• Replacing and transforming values
• Grouping and aggregating data
• Merging and appending queries
Data Modeling in Power BI
• Creating a Data Model
• Defining relationships between tables
• Star schema and snowflake schema in Power BI
• Difference between calculated columns and measures
• Creating calculated columns for custom data
• Optimizing Data Models
• Hiding and sorting columns
• Managing relationships and model performance
• Implementing hierarchical structures (drill-downs)
DAX (Data Analysis Expressions) Functions
• Introduction to DAX
• Syntax and structure of DAX
• Understanding row context and filter context
• Aggregation functions: SUM, MIN, MAX, COUNT, AVERAGE
• Logical functions: IF, SWITCH
• Text functions: CONCATENATE, LEFT, RIGHT
• Time intelligence functions: DATEADD, SAMEPERIODLASTYEAR, YTD, QTD, MTD
• Advanced measures for financial analysis (e.g., YTD growth, % changes)
• Handling complex scenarios with CALCULATE and FILTER
Data Visualization and Reporting
• Best Practices in Data Visualization
• Choosing the right visual for your data
• Overview of visualization types: bar charts, line charts, pie charts, maps, etc.
• Building dynamic and interactive visuals
• Customizing Visuals
• Formatting and styling visuals for clarity and impact
• Conditional formatting for highlighting key insights
• Using slicers and filters to add interactivity
• Creating drill-through and drill-down capabilities for deeper analysis
• Adding tooltips and custom visuals for enhanced reporting
• Simplifying and decluttering reports for better readability
Report Sharing and Collaboration
• Publishing reports to the cloud (Power BI Service)
• Sharing reports via email, Teams, and embedding in websites
• Setting up automatic data refreshes
• Scheduling reports and dashboards to update regularly
Module 3: SQL for Data Analysis
Introduction to SQL Server
• Overview of SQL Server
• What is SQL Server?
• Installation and Setup
• SQL Server Management Studio (SSMS) Interface
Basics of SQL
• Introduction to SQL
• SQL Syntax and Structure
• Data Types
• Basic SQL Commands
• SELECT, FROM, WHERE
• INSERT, UPDATE, DELETE
• Filtering and Sorting Data
• WHERE Clause
• ORDER BY Clause
Advanced SQL Queries
• Aggregate Functions
• COUNT, SUM, AVG, MIN, MAX
• Grouping Data
• GROUP BY Clause
• HAVING Clause
• Joining Tables
• INNER JOIN, LEFT JOIN, RIGHT JOIN, FULL JOIN
Data Manipulation and Transformation
• Subqueries and Nested Queries
• Common Table Expressions (CTEs)
• Window Functions
• ROW_NUMBER(), RANK(), DENSE_RANK(), NTILE()
• Data Transformation Techniques
Working with Complex Data Types
• Working with Dates and Times
• Date Functions
• String Functions
• CONCAT, SUBSTRING, CHARINDEX, REPLACE
SQL Server Advanced Topics
• Indexing and Performance Tuning
• Creating and Managing Indexes
• Query Optimization
• Stored Procedures and Functions
• Creating and Executing Stored Procedures
• User-Defined Functions
Data Analysis and Reporting
• Basic Data Analysis Techniques
• Descriptive Statistics
• Using SQL for Data Analysis
• Exploratory Data Analysis (EDA)
• Generating Reports
• Creating Simple Reports in SSMS
• Exporting Data to Excel
Hands-on Projects and Case Studies
• Real-world Data Analysis Projects
- Case Studies
Module 4: Python for Data Analysis
Introduction to Python for Data Analysis
• Overview of Python and its Applications in Data Analysis
• Why Python for Data Analysis?
• Setting Up Python Environment
• Introduction to Google Colab
Python Basics
• Python Syntax and Basics
• Variables, Data Types, and Operators
• Control Structures: if-else, loops
• Functions and Modules
• Defining and Calling Functions
• Importing and Using Modules
Data Structures and Handling
• Working with Lists, Tuples, and Dictionaries
• Introduction to NumPy
• Creating and Manipulating Arrays
• Array Operations and Broadcasting
Working with Data Sources
• Reading from and writing to a csv
• Reading documentation
• API calls
• Data Ethics
Data Manipulation with Pandas
• Introduction to Pandas
• DataFrames and Series
• Data Loading, Cleaning, and Preparation
• Reading and Writing Data (CSV, Excel, etc.)
• Handling Missing Data
• Data Transformation and Filtering
Data Analysis and Exploration
• Exploratory Data Analysis (EDA)
• Descriptive Statistics
• Data Visualization with Matplotlib and Seaborn
• Plotting and Customizing Graphs
• Grouping and Aggregating Data
• Groupby() and aggregate functions
Working with Dates and Times
• Date and Time Data Types and Operations
• Resampling and Time Series Analysis
• Date Functionality in Pandas
Practical Applications and Case Studies
• Real-world Data Analysis Projects
Add-Ons: Tableau for Data Analysis (Recorded videos)
Introduction to Tableau
• Overview of Tableau and its uses in data analysis.
• Understanding the Tableau interface.
• Connecting to data sources.
Data Preparation
• Data sourcing and importing.
Visualization Basics
• Creating basic visualizations (bar charts, line charts, pie charts, etc.).
• Applying filters and sorting data.
• Formatting visualizations for clarity.
Advanced Visualization Techniques
• Creating interactive dashboards.
• Using parameters and calculated fields.
• Implementing advanced chart types (treemaps, heatmaps, etc.).
Data Analysis
• Exploring trends and patterns in data.
• Conducting ad-hoc analysis with Tableau.
• Utilizing forecasting and trend analysis tools.
Mapping Data
• Geospatial analysis with maps.
.
• Analyzing location-based data.
Sharing and Collaboration
• Publishing workbooks to Tableau Public.
• Sharing insights and visualizations with stakeholders.
• Collaborating on projects within Tableau.
Add-Ons: R Language for Data Analysis
Introduction to R and RStudio
• Overview of R Language
• What is R and its Applications in Data Analytics?
• Installing R and RStudio
• Introduction to the RStudio Interface
• Basic R Syntax
• Variables and Data Types
• Basic Operations
Data Structures in R
• Vectors, Matrices, Lists, and Data Frames
• Creating and Manipulating Vectors
• Understanding Matrices
• Working with Lists
• Introduction to Data Frames
Data Manipulation with dplyr
• Introduction to the dplyr Package
• Installing and Loading dplyr
• Basic Data Manipulation
• Filtering Rows with filter()
• Selecting Columns with select()
• Arranging Rows with arrange()
• Mutating Data with mutate()
• Summarizing Data with summarize()
Basic Data Visualization with ggplot2
• Introduction to ggplot2
• Installing and Loading ggplot2
• Creating Basic Plots
• Scatter Plots, Line Plots, Bar Plots
• Customizing Plots
• Adding Titles, Labels, and Themes
Add-Ons: Introduction to Cloud Computing for Data Analysts
Overview of Cloud Computing
• Definition and Key Concepts of Cloud Computing
• What is Cloud Computing?
• Key Characteristics (On-Demand Self-Service, Broad Network Access, Resource Pooling, Rapid Elasticity, Measured Service)
• Types of Cloud Computing
• Public, Private, and Hybrid Clouds
• Cloud Service Models
• Infrastructure as a Service (IaaS)
• Platform as a Service (PaaS)
• Software as a Service (SaaS)
Cloud Computing for Data Analysis
• Benefits of Using Cloud for Data Analysis
• Scalability, Flexibility, Cost Efficiency
• Introduction to Cloud Storage Solutions
• Object Storage (e.g., Amazon S3, Azure Blob Storage, Google Cloud Storage)
• File Storage and Database Storage Options
• Data Warehousing in the Cloud
• Overview of Cloud Data Warehouses (e.g., Amazon Redshift, Google BigQuery, Azure Synapse Analytics)
Key Cloud Services for Data Analysts
• Introduction to Cloud Data Processing Tools
• Big Data Processing (e.g., AWS EMR, Azure HDInsight, Google Dataflow)
• Serverless Computing (e.g., AWS Lambda, Azure Functions, Google Cloud Functions)
• Cloud-Based SQL Databases
• Managed Database Services (e.g., Amazon RDS, Azure SQL Database, Google Cloud SQL)
• Introduction to Data Integration and ETL Tools in the Cloud
• ETL Services (e.g., AWS Glue, Azure Data Factory, Google Cloud Dataflow)
Practical Applications and Case Studies
• Real-World Examples of Cloud Data Analysis
• Case Study: Using Cloud Storage for Data Analysis
• Case Study: Data Warehousing and Big Data Processing
• Demonstration of Cloud Tools
• Brief Demo of a Cloud Storage Solution
• Brief Demo of a Cloud-Based Data Warehouse
Add-Ons: Start Freelancing on Upwork
Introduction to Upwork
• What is Upwork?
• Benefits of being an Upwork freelancer
• Overview of the Upwork platform
Setting Up Your Upwork Profile
• Creating an effective profile
• Crafting a compelling title and overview
• Highlighting your skills and expertise
• Building a portfolio and showcasing your work
Finding and Applying for Jobs
• Search strategies and filters
• Understanding job descriptions and requirements
• Crafting winning proposals
• Following up on proposals and interviews
Upwork Fees and Billing
• Understanding Upwork's fee structure
• Setting your rates and pricing strategies
• Invoicing and getting paid
Communication and Client Management
• Effective communication with clients
• Setting expectations and deliverables
• Managing revisions and feedback
• Building long-term client relationships
Upwork's Policies and Guidelines
• Upwork's terms of service
• Maintaining a good job success score
• Handling disputes and resolving issues
Growing Your Upwork Business
• Building a strong reputation and profile
• Earning and maintaining high ratings
• Leveraging Upwork's features and tools
• Expanding your service offerings
Bonus Tips and Best Practices
• Time management and productivity tips
• Networking and collaboration opportunities
• Continuing education and skill development
• Q&A and open discussion
In our comprehensive Data Analyst course, you'll delve into the fundamentals of data analysis, equipping you with the skills needed to thrive in today's data-driven world. Our expert-led curriculum covers a wide range of topics, including:
○ Data Wrangling: Learn how to clean, transform, and organize raw data for analysis.
○ Statistical Analysis: Master statistical techniques to derive meaningful insights from data.
○ Data Visualization: Harness the power of visualization tools like Tableau and Power BI to communicate findings effectively.
Predictive Modeling: Explore predictive analytics methods to forecast trends and outcomes.
Machine Learning: Gain hands-on experience with machine learning algorithms for data analysis and prediction.
○ SQL: Acquire proficiency in SQL for querying databases and extracting valuable information.
○ Real-World Projects: Apply your skills to real-world scenarios and build a portfolio of projects showcasing your expertise.
With our tailored curriculum and hands-on approach, you'll emerge from our Data Analyst course ready to tackle complex data challenges and drive decision-making processes with confidence.
○ Educational Background: While a specific degree may not always be required, most Data Analyst courses prefer candidates with a background in fields such as mathematics, statistics, computer science, engineering, economics, or related disciplines.
○ Basic Computer Skills: Candidates should possess basic computer skills and familiarity with using software applications. Proficiency in Microsoft Excel is recommended, as it forms the basis for data manipulation and analysis in the course.
○ Technical Requirements: Candidates must have access to a computer with internet connectivity to participate in online lectures, access course materials, and complete assignments.
○ Career Opportunities: Data analysis skills are in high demand across various industries, opening doors to lucrative career opportunities in fields such as finance, healthcare, e-commerce, marketing, and more.
○ Competitive Edge: With the proliferation of data-driven decision-making, possessing data analysis skills gives you a competitive edge in the job market, making you a valuable asset to employers.
○ Versatility: Data analysis skills are transferable across industries and roles, allowing you to explore diverse career paths and adapt to evolving job market trends.
○ Decision-Making Power: By mastering data analysis techniques, you gain the ability to extract actionable insights from complex datasets, enabling informed decision-making and driving business success.
○ Problem-Solving Skills: Data analysis involves critical thinking, problem-solving, and hypothesis testing, fostering the development of valuable analytical skills that are applicable in various contexts.
○ Career Growth: Data analysts often have opportunities for career advancement, with pathways to roles such as Data Scientist, Business Analyst, Data Engineer, and more, as they gain experience and expertise in the field.
○ Contribution to Innovation: Data analysis fuels innovation by uncovering hidden patterns, trends, and correlations that can lead to new product ideas, process improvements, and strategic initiatives within organizations.
○ Job Satisfaction: Working as a Data Analyst can be intellectually stimulating and rewarding, especially when you see the tangible impact of your insights on business outcomes
- Data Analysis Fundamentals: Understanding foundational concepts such as data types, data structures, data cleaning, and data manipulation techniques is essential for effective data analysis.
- Statistical Analysis: Learning statistical methods and techniques for summarizing data, testing hypotheses, and making inferences is crucial for deriving meaningful insights from datasets.
- Data Visualization: Mastering data visualization tools and techniques enables analysts to create visually compelling representations of data that facilitate understanding and decision-making.
- Programming Languages: Proficiency in programming languages such as Python, R, and SQL is essential for data manipulation, analysis, and automation tasks.
- Database Management: Understanding database management systems and SQL querying skills are important for accessing, retrieving, and managing data stored in databases.
- Machine Learning and Predictive Analytics: Exploring machine learning algorithms and techniques empowers analysts to build predictive models and uncover patterns and trends in data.
- Business Intelligence Tools: Familiarity with business intelligence tools like Tableau, Power BI, and QlikView allows analysts to create interactive dashboards and reports for data visualization and analysis.
- Problem-Solving and Critical Thinking: Developing problem-solving skills and critical thinking abilities enables analysts to approach complex data challenges effectively and derive actionable insights.
- Communication and Presentation Skills: Effective communication and presentation skills are essential for conveying analytical findings and insights to stakeholders in a clear and compelling manner.
- Real-World Projects and Case Studies: Engaging in hands-on projects and case studies provides practical experience and helps bridge the gap between theoretical knowledge and real-world applications.
What is Data Analyst training?
Data Analyst training is a structured program designed to equip individuals with the skills and knowledge needed to excel in the field of data analysis. It covers topics such as data manipulation, statistical analysis, data visualization, programming languages, and machine learning techniques.
Who can benefit from Data Analyst training?
Anyone with an interest in data analysis, regardless of their educational background or professional experience, can benefit from Data Analyst training. It is particularly valuable for individuals seeking to pursue careers in data analysis, business intelligence, or related fields.
What are the prerequisites for Data Analyst training?
While specific prerequisites may vary depending on the training program, having a basic understanding of mathematics, statistics, and computer science concepts is beneficial. Proficiency in programming languages like Python or R and familiarity with tools such as Excel and SQL may also be advantageous.
What can I expect to learn in Data Analyst training?
In Data Analyst training, you can expect to learn fundamental concepts of data analysis, including data cleaning, data manipulation, statistical analysis, data visualization techniques, programming languages, and tools used in the field.
What is the duration of the course?
The duration and format of the training is 6 months.
How can I choose the right Data Analyst training program?
When selecting a Data Analyst training program, consider factors such as the curriculum, instructor expertise, mode of delivery, duration, cost, accreditation, job placement assistance, and student reviews and testimonials.
Is certification available upon completion of the training?
Successful participants will get the AIN GenX and Skill Development Council Karachi certificates.
Is there ongoing support or resources available after completing the training?
Yes, participants will get continued support through Email and WhatsApp groups.
Instructor

Irfan Bakaly
Data Analyst
24+ years of experience in Data Analysis

Noor Surani
Data Analyst
Data Scientist
25+ years of experience in Data Analysis

Amynah Reimoo
Data Analyst
2+ years of experience in Data Analysis

Tamkeen Ahmed
Data Analyst
Supply Chain Profession
5+ years of Teaching Experience
Who this course is for:
Data Analyst
Duration
● 6 Months (72 Hours)
Classes
● In-Person/Online
Schedule
- Days: Saturday's Only
- Timing: 02:30 pm - 05:30 pm (PST)
Starting From
● 23 November, 2024
Course Fee
● Online
Rs. 9,000/- x 2 Installment
● In-Person:
Rs. 18,000/- x 2 Installment
Excluding the SDC Certificate Fee
Account Details
Bank: Habib Bank Limited
Account Title: AIN GenX
Account No: 5910-70000512-03
IBAN No: PK08 HABB 0059 1070 0005 1203
Secure a Verified Certificate from AIN GenX
Apply for Skill Development Council Certificate
Participants from Various  Companies 


What do participants say about AIN GenX?
As a human resource professional, I'm enhancing my skills in data analysis and business intelligence with AIN Genx (PVT) Ltd. The program, led by Mr. Irfan Bakaly and Nooruddin Surani, is well-structured and covers a wide range of material. The platform provided is helpful for comprehending concepts like data analytics, visualization, dashboard tools, and transformation. Learning is continuous, and with commitment, success is inevitable. I highly recommend this course for those looking to advance their skills.
Humaira NafeesHuman Resources Business Partner
I commend the diverse content in the data analytics course, especially the practical Excel analysis and Al integration modules facilitated by Mr. Irfan Bakaly. The comprehensive approach, including R language and SQL sessions, is proving effective for my transition from Electrical Engineering. Exceptional instruction from Mr. Bakaly and Mr. Noor, coupled with additional resources access, ensures a supportive and confidence-building learning experience.
Engr. Abdul Basit Ahmed QureshiEngr
I would like to share my currently ongoing journey with AIN GenX which is great so far. Currently, I am enrolled in their certified data analyst course and the learning outcome has increased after the passage of every class because of very experienced and humble mentors like Noor sir and Irfan sir this course is very deep and detailed with full sound knowledge. in short, this course is highly recommended.
Faizan PervaizCoordinator at Bahria Town
It's just two months to this exciting journey of learning the data analyst course and so far, it has been an exhilarating experience with learning new skills in MS Excel and more is yet to be unlocked. Too excited to learn more in this six-month journey from amazingly talented mentors.
Farah NazAsst. Director Clinical Governance and Trainings
The Data Analyst course has been phenomenal! The mentors Mr. Irfan Bakaly and Mr.Noor Surani are exceptional, and the course content is simply amazing. The AIN GenX team's support and expertise are outstanding. With two months behind me, I am thrilled for the remaining four months of this journey!
Muhammad Shahzad Ahmed
AIN GenX course in Power BI and Python was incredibly beneficial. The hands-on experience and expert guidance have enhanced my data analysis skills significantly, making complex tasks seem simple. I highly recommend AIN GenX for anyone looking to excel in data analytics.
Noman SaeedShipping and Port Industry