Financial Reporting Automation in Excel
Automating financial reporting in Microsoft Excel transforms how organizations manage their data. By using features like Power Query, Power Pivot, and Macros, finance professionals can eliminate repetitive tasks, reduce manual errors, and generate real-time insights with just a click. Automation ensures that reports remain accurate, consistent, and always up to date. Dynamic dashboards allow stakeholders to visualize financial performance instantly. With Excel’s powerful data-modeling tools, financial teams spend less time compiling data and more time analyzing results—enabling faster, smarter business decisions. Embrace automation in Excel to streamline workflows and elevate the accuracy of your financial reporting.
Outline
Module 1: Foundation of Financial Reporting Automation
• Traditional vs. Automated Reporting
• Overview of automation tools in Excel (Power Query, Named Ranges, Tables)
• Structuring financial data for automation
• Connecting Excel to ERP exports (CSV/TXT/Excel files)
• Setting up folder hierarchy for OneDrive-based automation
Hands-On:
• Create a structured data folder in OneDrive
• Load trial balance and cost center data into Excel
• Create Excel Tables and link dynamic ranges
Module 2: Data Cleaning and Transformation with Power Query
• Introduction to Power Query editor
• Combining multiple monthly files automatically
• Data cleaning (remove blanks, change types, merge columns)
• Creating lookup tables (Chart of Accounts, Cost Centers)
• Adding automated mapping (e.g., Account → Category → FS Line Item)
Hands-On:
• Combine all monthly TBs into one dataset
• Create transformations that auto-refresh with new month files
• Build mapping logic for account classification
Module 3: Financial Statements & Automation
• Using formulas (SUMIFS, INDEX-MATCH, XLOOKUP) for dynamic reporting
• Automating Profit & Loss Statement
• Linking Trial Balance to P&L lines dynamically
• Creating dynamic Period selection using dropdown (Data Validation)
• Adding auto-refresh & variance analysis (vs Budget or Last Month)
Hands-On:
• Create fully linked P&L statement
• Add Month/Year selection
• Refresh data automatically from OneDrive folder
Module 4: Interactive Dashboards and KPI Reporting
• Creating Pivot Tables and Pivot Charts
• Adding Slicers and Timelines for interactivity
• Designing a clean, executive-level dashboard
• Using conditional formatting and dynamic charts
• Automating KPI metrics (e.g., Gross Margin %, Expense Ratio)
Hands-On:
• Build a “Finance Dashboard” sheet
• Link visuals to P&L and Balance Sheet
• Add slicers for month/entity
Module 5: Publishing, Refreshing & Sharing via OneDrive
• Saving and syncing Excel reports to OneDrive
• Enabling Auto-Refresh using Power Query connections
• Setting up OneDrive version control
• Sharing live report links with management
• Data privacy and access control in Office 365
• Report refresh demonstration (new month file addition)
Hands-On:
• Place automated workbook in OneDrive folder
• Share “View Only” link with management
• Test refresh and confirm live updates
Course Fee
● Online
Rs. 5,000/- Total
- Once paid, the fee is non-refundable and non-transferable
Account Details
Bank: Habib Bank Limited
Account Title: AIN GenX
Account No: 5910-70000512-03
IBAN No: PK08 HABB 0059 1070 0005 1203
Faciliators

Irfan Bakaly
Data Analyst
25+ years of experience in Data Analysis

Noor Surani
Tech Entrepreneur
25+ years of experience in Data Analysis

Waqas Younas
ACMA, CAF
12+ years of experience in Financial Analysis
Who this course is for:
Finance Professionals, Excel Users, Data Analysts, Business Managers, Students & Educators
Duration
● 4 Weeks (10 Hours)
Classes
● Online via Zoom
Schedule
- Day: Sunday's Only
- Timing: 02:30 - 05:00 pm (PST)
Starting From
● Sunday, 08 February, 2026
Participants from Top Organizations


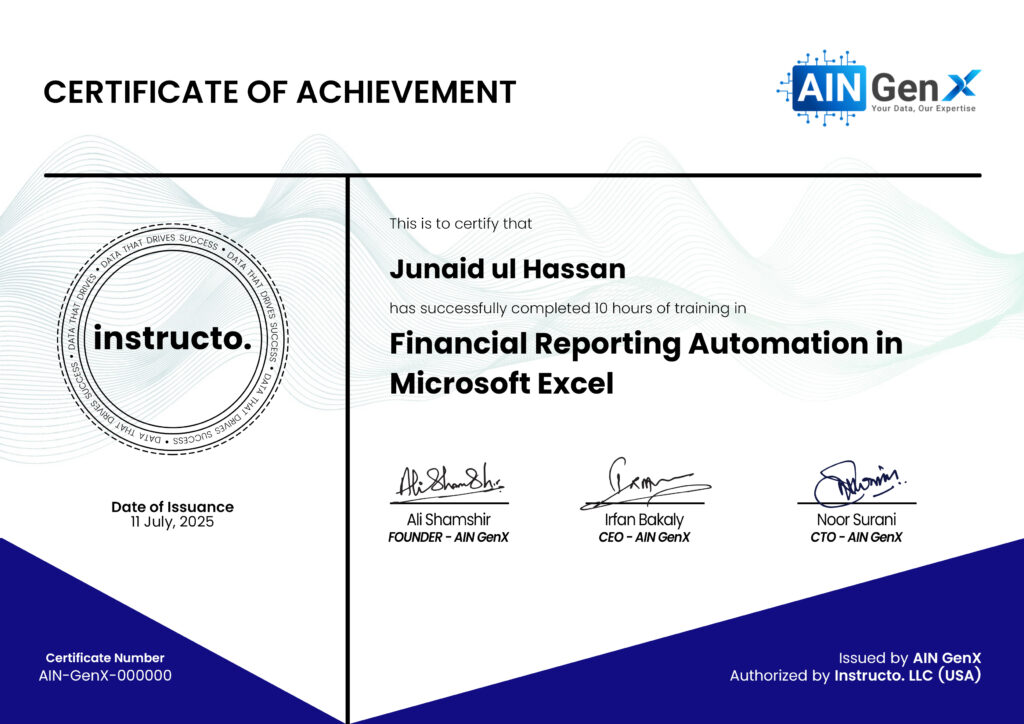
Certificates

