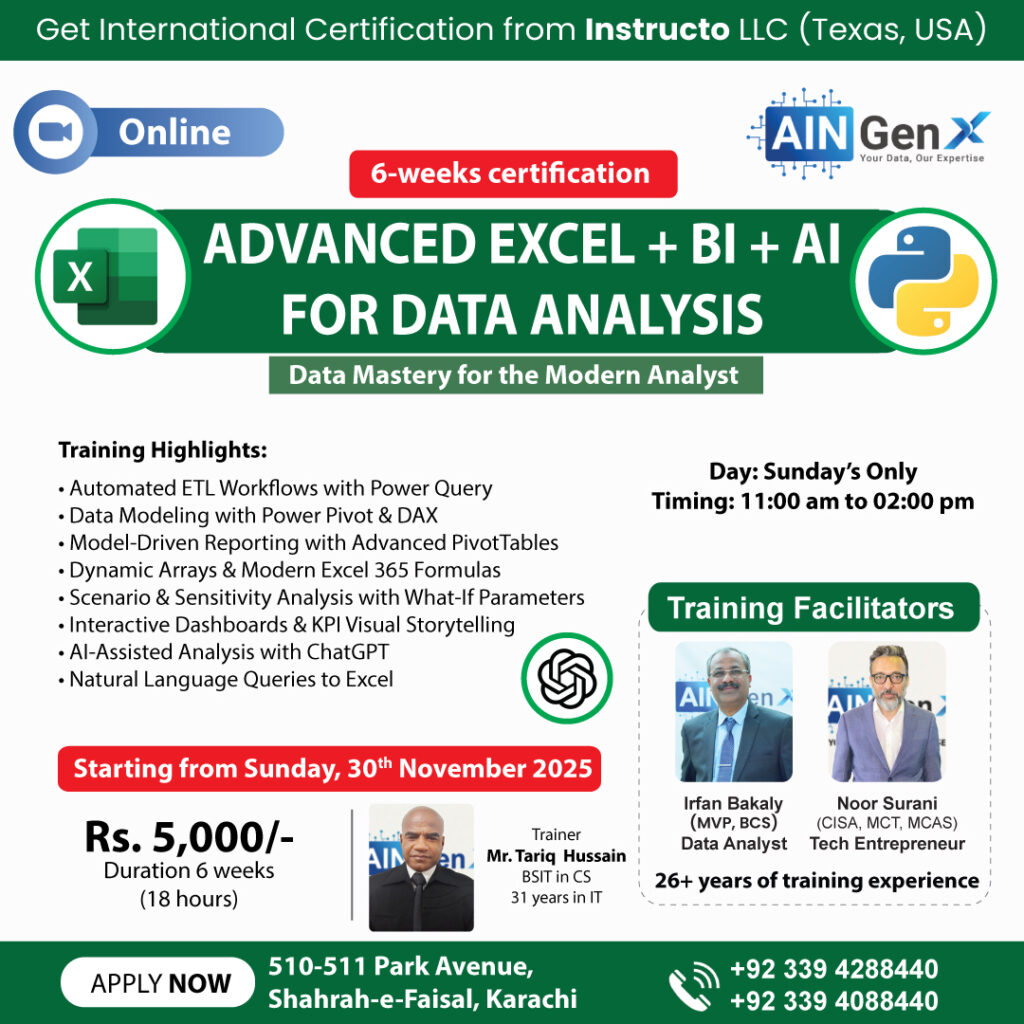
ADVANCED EXCEL + BI + AI FOR DATA ANALYSIS
Advanced Excel + BI + AI: The Future of Data Analysis In today’s data-driven world, mastering Advanced Excel, Business Intelligence (BI), and Artificial Intelligence (AI) is essential for effective analysis. Advanced Excel empowers users with dynamic formulas, pivot tables, and automation to handle complex datasets. BI tools, such as Power BI and Tableau, transform raw data into interactive dashboards for faster decision-making. AI adds another layer by enabling predictive analytics, pattern recognition, and automated insights. Together, these tools help professionals move beyond traditional reporting to smarter, data-backed strategies. Whether for business growth or research, Advanced Excel + BI + AI offers unmatched power in turning data into meaningful action.
Outline
Module 1: Automated ETL Workflows with Power Query
• Introduction to Power Query
o ETL (Extract, Transform, Load) concepts in Excel
o Power Query vs. traditional Excel data cleaning
• Data Extraction
o Connecting to multiple data sources (Excel, CSV & Folder)
o Automating data imports and refreshes
• Data Transformation
o Data profiling & column transformations
o Splitting, merging, grouping & pivoting data
o Removing duplicates, handling errors, and data validation
• Workflow Automation
o Creating reusable queries & parameterized queries
o Refresh schedules & incremental data loads
Module 2: Data Modeling with Power Pivot & DAX
• Power Pivot Basics
o Understanding data models & relationships
o Star schema design principles
• DAX Fundamentals
o Calculated columns vs. measures
o Aggregation functions (SUM, AVERAGE, COUNTROWS, DISTINCTCOUNT)
• Intermediate DAX
o Time Intelligence functions (YTD, MTD, QTD, YoY growth)
o FILTER, CALCULATE, RELATED, ALL, VALUES
• Advanced DAX
o KPIs and scenario-based measures
o Handling many-to-many relationships
Module 3: Model-Driven Reporting with Advanced PivotTables
• PivotTable Deep Dive
o Building PivotTables from Power Pivot models
o Hierarchies, slicers, and timelines
• Calculated Fields & Measures in PivotTables
• Grouping & Drill-Down Techniques
o Custom groupings (by month, by category, etc.)
o Drill-through reports
• PivotCharts & Visual Enhancements
o Linking multiple PivotTables
o Combining PivotTables & charts for dashboards
Module 4: Dynamic Arrays & Modern Excel 365 Formulas
Advanced Formulas & Functions
• Nested functions (IF, AND, OR, IFS)
• Lookup functions (VLOOKUP, HLOOKUP, XLOOKUP, INDEX & MATCH)
• Text, Date, and Time functions
• Dynamic array functions (FILTER, SORT, UNIQUE, SEQUENCE)
Data Tools & Validation
• Data validation rules & custom formulas
• What-If analysis (Goal Seek, Data Tables, Scenario Manager)
• Consolidating data across sheets/workbooks
Module 5: Interactive Dashboards & KPI Visual Storytelling
• Dashboard Design Principles
o Choosing the right chart for the story
o Avoiding clutter & ensuring readability
• Interactivity Features
o Slicers, timelines, and form controls
o Linked charts and conditional formatting
• KPI Design
o Traffic lights, gauges, and sparklines
o Target vs. actual comparisons
• Best Practices
o Layouts, color theory, and storytelling with data
Module 6: AI-Assisted Analysis with ChatGPT
• Introduction to ChatGPT with Excel
o Introduction to Excel AI and ChatGPT Integration
o ChatGPT for Excel Formulas
o Exploratory Data Analysis (EDA) with ChatGPT
o Data Cleaning, Transformation & Preprocessing
o Advanced Data Workflows with ChatGPT
o Introduction to Excel VBA and Macros with ChatGPT
Course Fee
● Online
Rs. 5,000/ Total
Fee once paid is not refundable and not transferable.
Account Details
Bank: Habib Bank Limited
Account Title: AIN GenX
Account No: 5910-70000512-03
IBAN No: PK08 HABB 0059 1070 0005 1203
Faciliators

Irfan Bakaly
Data Analyst
25+ years of experience in Data Analysis

Noor Surani
Tech Entrepreneur
25+ years of experience in Data Analysis
Who this course is for:
Business Analysts, Data Professionals, Finance Specialists, Researchers, and Students
Duration
● 6 Weeks (18 Hours)
Classes
● Online via Zoom
Schedule
- Day: Sunday's Only
- Timing: 11:00 am- 02:00 pm (PST)
Starting From
● Sunday, 30 November, 2025
Participants from Top Organizations


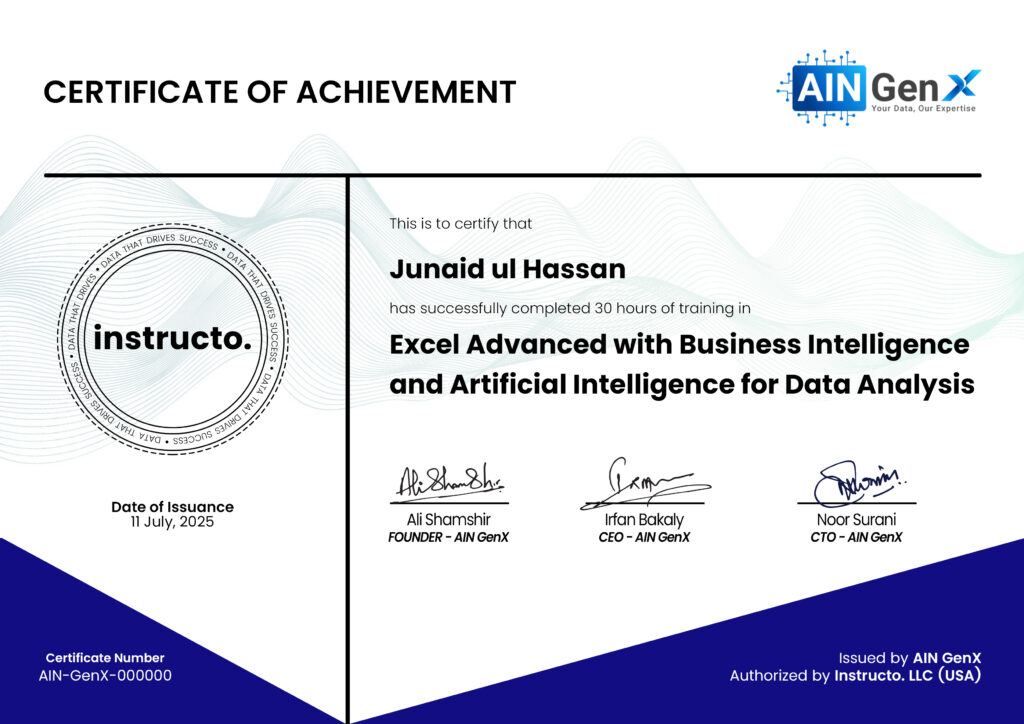
Certificates

