Power BI & SQL
Master data analysis and visualization with our Power BI & SQL training to unlock actionable business insights
Our Power BI & SQL Training equips learners with essential skills to analyze, visualize, and manage data effectively. Participants gain hands-on experience in creating interactive dashboards, writing SQL queries, and integrating datasets. This training empowers professionals to transform raw information into actionable insights, driving smarter business decisions with confidence.
Outline
Module 1: Power BI for Data Analysis
Introduction to Power BI Desktop
• Overview of Power BI components: Desktop, Service, and Mobile
• Key features and benefits of Power BI Desktop
• Understanding the Power BI interface and workflow
Data Transformation with Power Query
• Importing data from Excel, databases, CSV files, and cloud services
• Handling multiple data sources
• Removing duplicates and filtering data
• Pivoting and unpivoting data
• Splitting and merging columns
• Conditional columns
• Replacing and transforming values
• Grouping and aggregating data
• Merging and appending queries
Data Modeling in Power BI
• Creating a Data Model
• Star schema and snowflake schema in Power BI
• Difference between calculated columns and measures
• Creating calculated columns for custom data
DAX (Data Analysis Expressions) Functions
• Introduction to DAX
• Understanding row context and filter context
• Aggregation functions: SUM, MIN, MAX, COUNT, AVERAGE
• Logical functions: IF
• Text functions: CONCATENATE, LEFT, RIGHT
• Time intelligence functions: DATEADD, YTD, QTD, MTD
• Advanced measures for financial analysis (e.g., YTD growth, % changes)
• Handling complex scenarios with CALCULATE and FILTER
Data Visualization and Reporting
• Best Practices in Data Visualization
• Choosing the right visual for your data
• Overview of visualization types: bar charts, line charts, pie charts, maps, etc.
• Building dynamic and interactive visuals
• Customizing Visuals
• Formatting and styling visuals for clarity and impact
• Conditional formatting for highlighting key insights
• Using slicers and filters to add interactivity
• Creating drill-through and drill-down capabilities for deeper analysis
• Adding tooltips and custom visuals for enhanced reporting
Report Sharing and Collaboration
• Publishing reports to the cloud (Power BI Service)
• Sharing reports via email, Teams, and embedding in websites
• Setting up automatic data refreshes
• Scheduling reports and dashboards to update regularly
Module 2: SQL for Data Analysis
Introduction to SQL Server
• Overview of SQL Server
• What is SQL Server?
• Installation and Setup
• SQL Server Management Studio (SSMS) Interface
Basics of SQL
• Introduction to SQL
• SQL Syntax and Structure
• Data Types
• Basic SQL Commands
• SELECT, FROM, WHERE
• INSERT, UPDATE, DELETE
• Filtering and Sorting Data
• WHERE Clause
• ORDER BY Clause
Advanced SQL Queries
• Aggregate Functions
• COUNT, SUM, AVG, MIN, MAX
• Grouping Data
• GROUP BY Clause
• HAVING Clause
• Joining Tables
• INNER JOIN, LEFT JOIN, RIGHT JOIN, FULL JOIN
Data Manipulation and Transformation
• Subqueries and Nested Queries
• Common Table Expressions (CTEs)
• Window Functions
• ROW_NUMBER(), RANK(), DENSE_RANK(), NTILE()
• Data Transformation Techniques
Working with Complex Data Types
• Working with Dates and Times
• Date Functions
• String Functions
• CONCAT, SUBSTRING, CHARINDEX, REPLACE
SQL Server Advanced Topics
• Indexing and Performance Tuning
• Creating and Managing Indexes
• Query Optimization
• Stored Procedures and Functions
• Creating and Executing Stored Procedures
• User-Defined Functions
Data Analysis and Reporting
• Basic Data Analysis Techniques
• Descriptive Statistics
• Using SQL for Data Analysis
• Exploratory Data Analysis (EDA)
• Generating Reports
• Creating Simple Reports in SSMS
• Exporting Data to Excel
Course Fee
● Online
Rs. 10,000/- Total Fee
(One time payment)
Account Details
Bank: Habib Bank Limited
Account Title: AIN GenX
Account No: 5910-70000512-03
IBAN No: PK08 HABB 0059 1070 0005 1203
Faciliators

Irfan Bakaly
Data Analyst
25+ years of experience in Data Analysis

Noor Surani
Tech Entrepreneur
25+ years of experience in Data Analysis

Saad Ahmed
Data Analyst
14+ years of Teaching Experience
Who this course is for:
Working Professionals, Entrepreneurs & Business Owners, Beginners & Students, Anyone Interested in Data
Duration
● 10 weeks (30 Hours)
Classes
● Online via Zoom
Schedule
- Day: Sunday's Only
- Timing: 11:00 - 02:00 pm (PST)
Starting From
● Sunday, 04 January, 2026
Fee once paid, non-refundable, and non-transferable.
Participants from Top Organizations


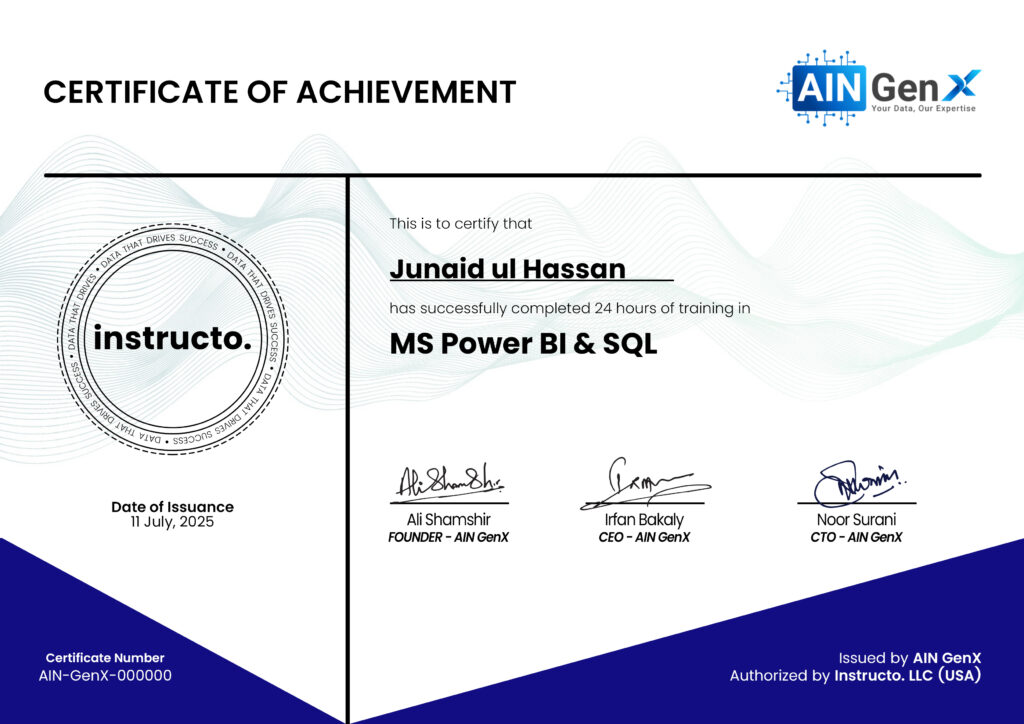
Certificates

